
Texas recorded 210,217 authorized housing units in 2025, down 6.9% from 2024 and the lowest annual total in the six years covered by this analysis. Harris County led the state with 30,909 permitted units, while Houston was the leading incorporated place with 11,878.
The figures come from the U.S. Census Bureau’s Building Permits Survey (BPS), which tracks residential units authorized by building permits. A permit is an indicator of planned construction, not proof that a home was started or completed. The findings therefore show where authorized residential construction was concentrated, not a count of homes delivered.
Key findings
- Statewide permits declined for the fourth consecutive year after the 2021 peak. Texas went from 265,955 units in 2021 to 210,217 in 2025, a 21.0% decline.
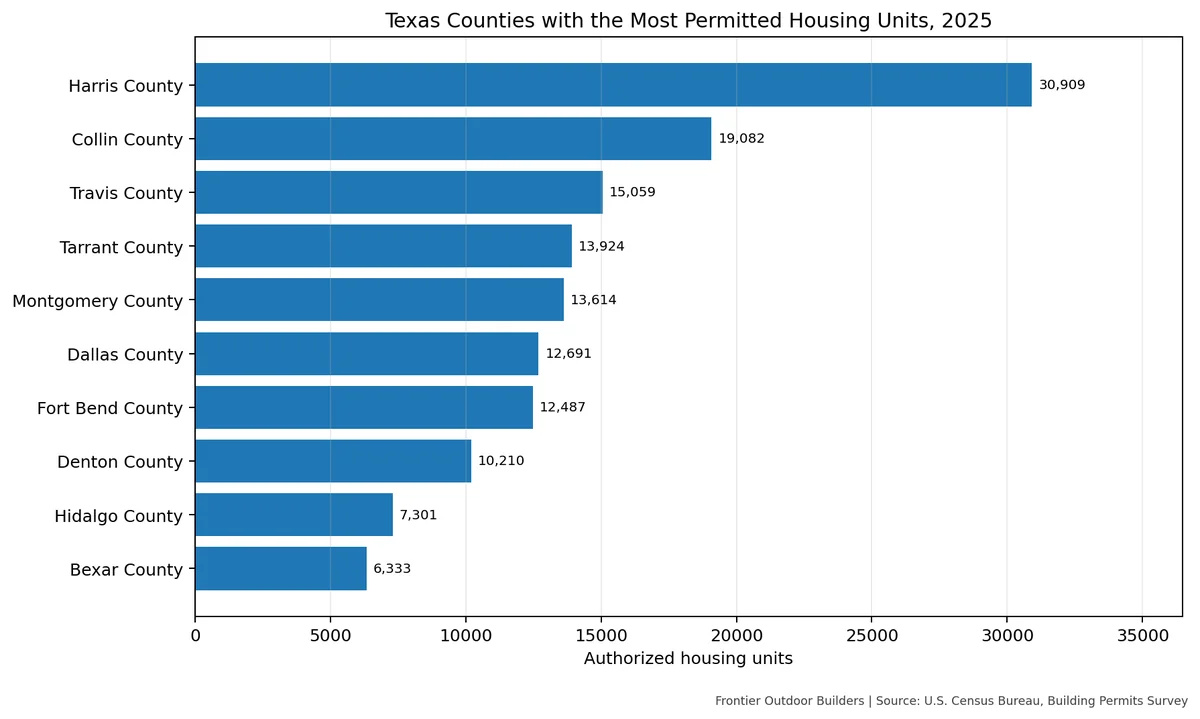
- Harris County remained the largest county market. It recorded 30,909 units in 2025, ahead of Collin County (19,082) and Travis County (15,059).
- Houston led incorporated places, but Fort Worth and Austin followed. Houston recorded 11,878 units, Fort Worth 9,437, and Austin 8,893.
- Frisco’s annual total surged in 2025. It rose from 1,333 units in 2024 to 5,652 in 2025, an increase of 4,319 units.
- Dallas and Frisco posted the largest absolute gains among incorporated places from 2020 to 2025 among places with data in both years, increasing by 3,302 and 2,473 units, respectively.
- The housing mix shifted. Single-family permits fell 11.2% between 2020 and 2025. Multifamily permits were 3.6% lower than in 2020, after reaching a six-year high in 2022; they were 35.6% below that peak by 2025.
Texas residential permitting: 2020–2025
| Year | Total authorized units | Single-family units | Multifamily units (2+ units) | Change from prior year |
|---|---|---|---|---|
| 2020 | 230,503 | 158,242 | 72,261 | — |
| 2021 | 265,955 | 179,620 | 86,335 | +15.4% |
| 2022 | 263,007 | 154,793 | 108,214 | -1.1% |
| 2023 | 232,373 | 149,860 | 82,513 | -11.6% |
| 2024 | 225,756 | 158,121 | 67,635 | -2.8% |
| 2025 | 210,217 | 140,579 | 69,638 | -6.9% |
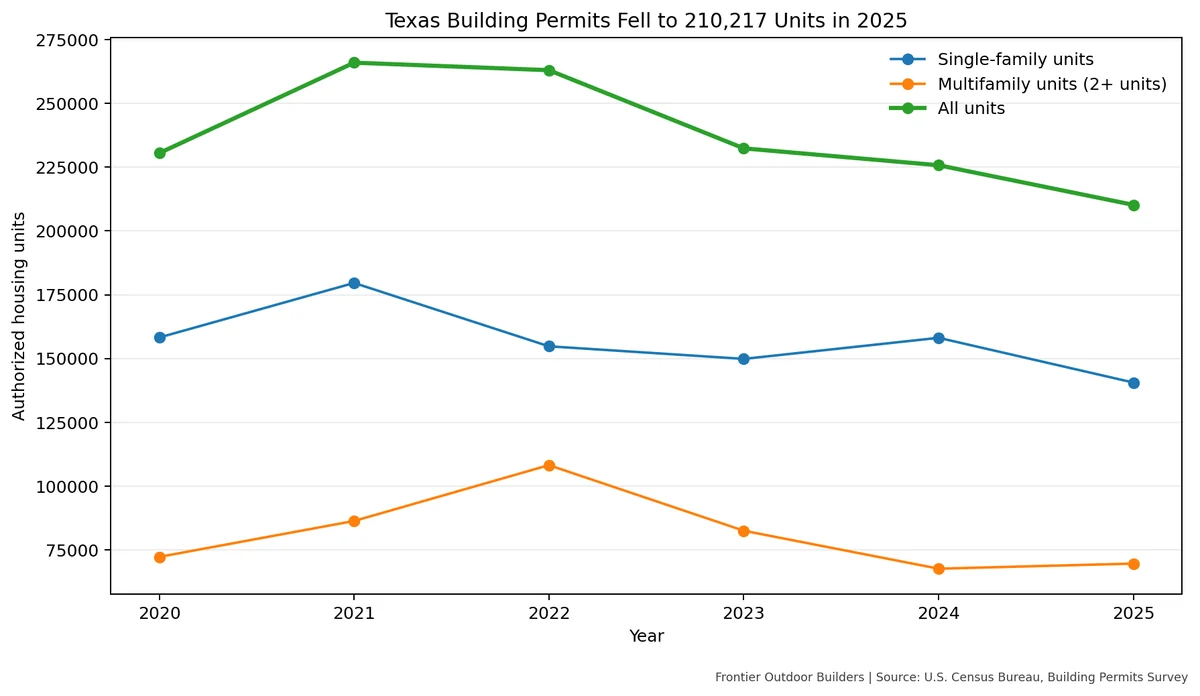
The annual total peaked in 2021 at 265,955 units. By 2025, the total had fallen 21.0% from that peak and 8.8% from 2020. The 2025 year-over-year decline was 15,539 units.
The statewide pattern was not uniform across housing types. Single-family permits accounted for 66.9% of permitted units in 2025, compared with 68.7% in 2020. Multifamily permits made up 33.1% in 2025. The multifamily total peaked at 108,214 units in 2022 and fell to 69,638 in 2025.
Counties with the most permitted units in 2025
Harris County ranked first, with 30,909 units. Collin County was second with 19,082, followed by Travis County with 15,059. Tarrant, Montgomery, Dallas, Fort Bend, Denton, Hidalgo and Bexar counties completed the top ten.
| Rank | County | 2025 units | 2024 units | Change, 2024–2025 | Change, 2020–2025 |
|---|---|---|---|---|---|
| 1 | Harris County | 30,909 | 29,936 | +3.3% | -16.4% |
| 2 | Collin County | 19,082 | 18,813 | +1.4% | +29.0% |
| 3 | Travis County | 15,059 | 16,990 | -11.4% | -44.5% |
| 4 | Tarrant County | 13,924 | 18,858 | -26.2% | -2.1% |
| 5 | Montgomery County | 13,614 | 13,246 | +2.8% | +33.2% |
| 6 | Dallas County | 12,691 | 12,711 | -0.2% | +19.4% |
| 7 | Fort Bend County | 12,487 | 12,017 | +3.9% | -11.4% |
| 8 | Denton County | 10,210 | 10,507 | -2.8% | +2.4% |
| 9 | Hidalgo County | 7,301 | 7,292 | +0.1% | +49.2% |
| 10 | Bexar County | 6,333 | 8,349 | -24.1% | -39.1% |
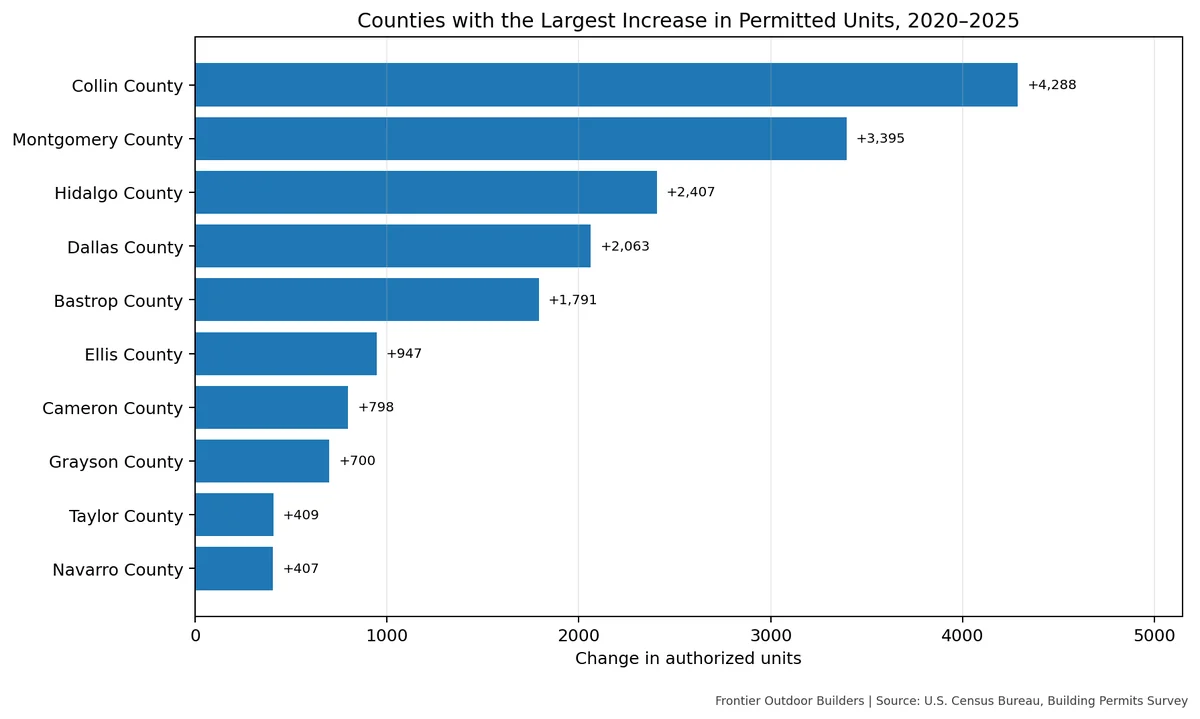
The rankings also show why a single-year ranking and a growth ranking answer different questions. Harris County had the highest 2025 total, but Collin County recorded the largest absolute increase among counties with data in both 2020 and 2025. Collin rose by 4,288 units over the five-year comparison. Montgomery County increased by 3,395 units, and Hidalgo County increased by 2,407.
The place files also report permitting in county unincorporated areas separately from incorporated places. In 2025, the largest such records were Harris County Unincorporated Area (17,807 units), Montgomery County Unincorporated Area (10,919), and Fort Bend County Unincorporated Area (7,107). These are not cities, so they are excluded from the incorporated-place ranking. Because county- and place-level totals do not fully reconcile in every year, these records should be treated as a separate reporting view rather than added to county totals.
Cities and other incorporated places
At the incorporated-place level, Houston recorded the most authorized units in 2025, with 11,878 units. Fort Worth ranked second with 9,437; Austin was third with 8,893. Dallas ranked fourth, followed by Frisco and San Antonio.
| Rank | Place | 2025 units | 2024 units | Change, 2024–2025 | Change, 2020–2025 |
|---|---|---|---|---|---|
| 1 | Houston | 11,878 | 11,898 | -0.2% | -28.4% |
| 2 | Fort Worth | 9,437 | 13,148 | -28.2% | -1.4% |
| 3 | Austin | 8,893 | 9,444 | -5.8% | -49.7% |
| 4 | Dallas | 6,993 | 6,038 | +15.8% | +89.5% |
| 5 | Frisco | 5,652 | 1,333 | +324.0% | +77.8% |
| 6 | San Antonio | 5,320 | 6,258 | -15.0% | -42.3% |
| 7 | Denton | 3,438 | 1,976 | +74.0% | +20.2% |
| 8 | Fulshear | 3,264 | 3,970 | -17.8% | +29.7% |
| 9 | McKinney | 3,040 | 3,910 | -22.3% | +32.1% |
| 10 | Celina | 2,803 | 4,357 | -35.7% | +37.9% |
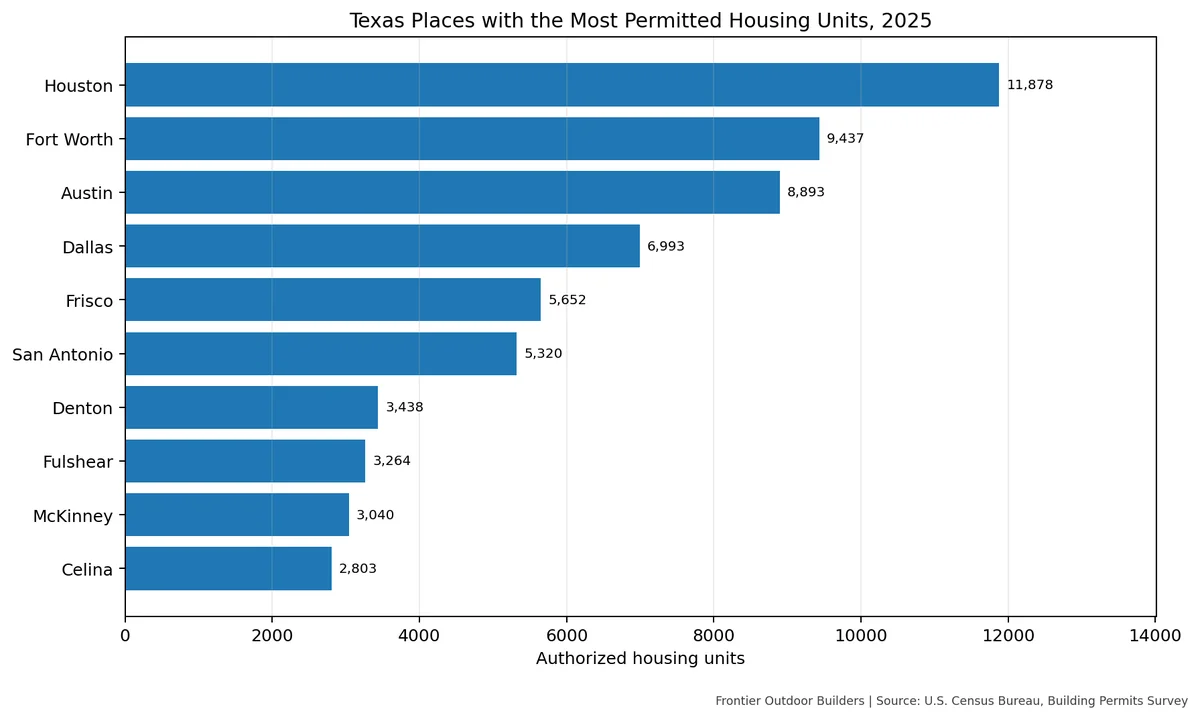
Frisco’s rise is the sharpest year-over-year movement among the top ten places. It recorded 5,652 units in 2025, up from 1,333 in 2024. Denton also increased, from 1,976 to 3,438. Fort Worth moved in the opposite direction, declining from 13,148 to 9,437, while Celina fell from 4,357 to 2,803.
Those changes should not be interpreted in isolation. Annual permit counts can be volatile because a small number of large multifamily projects can materially change a city’s total. The six-year table and underlying CSVs are provided so readers can inspect longer-term patterns instead of relying on one year alone.
Where permits increased most between 2020 and 2025
Among incorporated places with reported records in both comparison years, Dallas had the largest absolute increase: from 3,691 units in 2020 to 6,993 in 2025, a gain of 3,302. Frisco increased by 2,473 units, from 3,179 to 5,652. Lavon increased by 992, and Princeton by 787.
| Place | 2020 units | 2025 units | Change | Percentage change |
|---|---|---|---|---|
| Dallas | 3,691 | 6,993 | 3,302 | +89.5% |
| Frisco | 3,179 | 5,652 | 2,473 | +77.8% |
| Lavon | 274 | 1,266 | 992 | +362.0% |
| Princeton | 823 | 1,610 | 787 | +95.6% |
| Celina | 2,033 | 2,803 | 770 | +37.9% |
| Fulshear | 2,517 | 3,264 | 747 | +29.7% |
| McKinney | 2,302 | 3,040 | 738 | +32.1% |
| Carrollton | 463 | 1,166 | 703 | +151.8% |
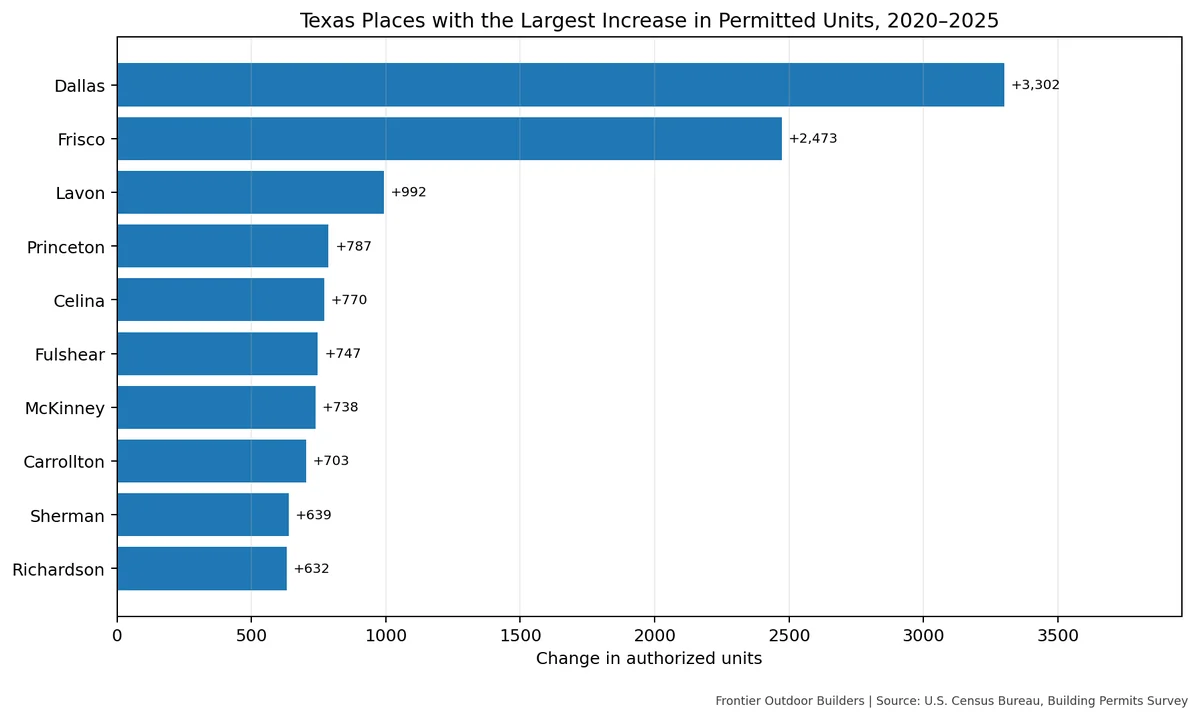
At the county level, Collin County had the largest absolute gain among counties with records in both years, rising from 14,794 units in 2020 to 19,082 in 2025, an increase of 4,288. Montgomery County increased by 3,395 units and Hidalgo County by 2,407.
Percentage growth can spotlight smaller markets, but it needs a base-size caveat. For example, a place that rises from a few dozen permits to several hundred can post a very large percentage increase while adding fewer units than a larger city. For that reason, this analysis emphasizes absolute changes alongside percentages.
Single-family and multifamily permits
The county-level data indicate that Texas authorized 140,579 single-family units and 69,638 units in buildings with two or more units in 2025. Single-family permits were lower than in 2020, while multifamily permits remained close to their 2020 level but well below the 2022 peak.
The split matters for interpreting housing activity. Single-family permits are more directly associated with detached and attached one-unit housing projects, while the multifamily category combines buildings containing two units, three to four units, and five or more units. The data files preserve those detailed categories so researchers can examine them separately.
What this means for housing and home-improvement businesses
The data identify areas where authorized residential construction was concentrated, which can be a useful starting point for researching demand for fencing, gates, decks, porches, landscaping, and other property-related work. They do not measure demand for any specific home-improvement service, however. A permit for a housing unit does not tell us whether the property will need a fence, what the owner will spend, or when the work will occur.
For market research, the county and place rankings are best treated as a first screening layer. Businesses can combine them with local housing stock, new subdivision maps, household income, lot characteristics, local regulations, and their own lead or sales data before prioritizing a market.
Download the Texas Building Permits Data (2020–2025)
Want to explore the numbers behind this report? Download the datasets used in our analysis of Texas residential building permits from 2020 through 2025.
These files allow you to examine local permitting patterns, compare counties and incorporated places, and identify areas where residential construction activity has increased or declined.
Available datasets
1. Texas County Building Permit Rankings and Trends, 2020–2025
Download the county-level dataset to compare annual building permit counts, rankings, and changes in residential permitting across Texas counties.
2. Texas City and Incorporated-Place Rankings and Trends, 2020–2025
Explore the place-level data to compare incorporated communities, identify changes in permitting activity, and investigate local housing construction trends.
3. Data Validation and Reconciliation Report
This supporting file documents the comparison between county-level totals and the sum of permit-issuing place records. Review it to understand the differences between the two reporting levels.
4. Complete Research Package
Prefer everything in one file? Download the ZIP package containing the article, datasets, charts, methodology notes, and source data files.
About the data
The analysis uses the U.S. Census Bureau's Building Permits Survey. Building permits measure authorized residential construction, not necessarily homes completed or ultimately built.
County and place-level figures represent different geographic reporting levels and should not be added together. Please consult the methodology and validation report when comparing totals.
Source: U.S. Census Bureau, Building Permits Survey. Analysis and compilation by Frontier Outdoor Builders.
Methodology and limitations
- Primary source: U.S. Census Bureau, Building Permits Survey (BPS), annual county and South Region place files for 2020–2025. Texas was selected using state FIPS code 48.
- Measure: Authorized housing units, not the number of buildings. The total is calculated by adding units in one-unit buildings, two-unit buildings, three-to-four-unit buildings, and buildings with five or more units.
- County rankings: Derived from the annual county files. The county file totals are used for statewide trend calculations because they reproduce the published statewide annual totals used in this analysis.
- Place rankings: Derived from the South Region place files filtered to Texas. The special FIPS place code
99990denotes a county’s unincorporated area in these files and is excluded from incorporated-place rankings. Those records remain in the complete place-level CSV. - Year-over-year and five-year comparisons: Calculated from the published annual counts. Place and county growth comparisons are reported only when the entity has data in both comparison years; missing records are not automatically treated as zero for the change calculations.
- Data reconciliation: The sum of all Texas place-file records differs from the county-file total in 2020, 2021, 2022 and 2025 by 835, 793, 2,745 and 855 units, respectively; the totals match in 2023 and 2024. County and place tables are therefore presented as separate reporting views and must not be added together. Rankings are calculated within each level.
- Interpretation: Permits are an early indicator of construction activity. They do not establish that construction began or was completed. Counts are not adjusted for population, housing stock, or the size of each jurisdiction.
- Volatility: Large multifamily projects can move annual totals substantially. Percentage changes for small starting values can also be misleading, so absolute changes are included.
Source files
- Census Building Permits Survey
- County annual data directory
- South Region place annual data directory
Download the supporting data
The accompanying CSV files include the statewide annual series, county-level records and rankings, and Texas place-level records and rankings. The complete files preserve the annual counts used to produce the tables and visualizations in this report.
County Data City and Place Data Data Validation Report Complete Research Package